
Trinidad & Tobago official audited non-associated proved gas reserves declined by 7.8 % between December 2014 and December 2015, down from 11.5 trillion cubic feet to 10.6 (tcf). Unrisked “3P” reserves (that is the total of proved, probable and possible) showed a similar level of decline (8.2%) while overall unrisked exploration resources showed a relatively small decline of just 1.6%, down from 43.8 tcf to 43.1 tcf.
Gas reserves or resources can be presented as either risked or unrisked figures. The unrisked figures are calculated by adding up all of the different reserves and all of the exploration prospects. The risked data on the other hand applies a risk percentage based on average previous drilling success rates – meaning that if in a given basin the exploration drilling success rate has historically been 35%, then 100 tcf of unrisked exploration resources would equal 35 tcf of risked exploration resources.
This means that there will be no differences between risked and unrisked proved (1P) reserves and progressively bigger differences as you move through probable and possible (2 & 3 P) reserves and finally the biggest differences between unrisked and risked exploration resources. This can be seen in the Trinidad & Tobago Ryder Scott audit data for 2015.

Table 1: Risked vs unrisked reserves and resources 2015 (tcf)
In the past Ryder Scott typically presented the unrisked data in their public presentations of their annual audit of non-associated reserves and resources in Trinidad & Tobago.
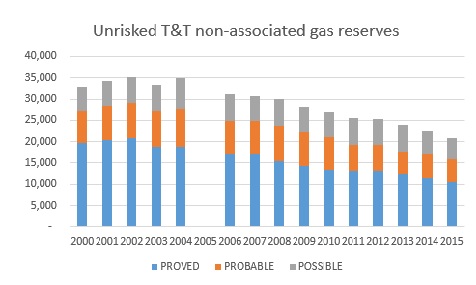
Graph 1: Unrisked non-associated gas reserves, 2000 – 2015 (bcf)
NB: no audit was conducted in 2005
The data shows that the national non-associated 3P unrisked gas reserves, as audited by Ryder Scott, have continue to decline since 2004, as companies have not replaced all of the reserves that have been produced.
The proved reserves to production ratio (R/P) stood at 7.6 years as of December 2015, down from 7.7 years in December 2014. The significant decline in gas production since 2010 means that the R/P ratio has not declined as fast as proved reserves have declined.
Unrisked exploration resources show a very small decline between 2014 and 2015, after a number of years in which they showed fairly significant growth. This indicates that there are still significant potential gas reservoirs to be discovered and developed in Trinidad & Tobago. It must always be remembered, however, that upstream gas exploration and development is a very risky activity. Many exploration activities will result in very expensive dry holes, even in mature provinces such as Trinidad & Tobago. Risked exploration resource figures are therefore much lower than unrisked exploration resource figures.

Graph 2: Unriskednon-associated gas exploration resources, 2000 – 2015 (bcf)
NB: no audit was conducted in 2005